
Now more than ever brands are capitalizing on using social media analytics. Marketers are diving in to find insights on their customers, their product and even their competitors. The first step to uncovering this information is knowing which tools to use and how to use them strategically.
Twitter Analytics is a great tool for tracking and evaluating any campaigns, social media programs and content. This is why we’ve designed the guide below on how you can start using Twitter Analytics and the analysis it provides.
-
The Basics
Twitter Analytics is built into the Twitter platform and it provides an in-depth report on how much traction your campaign is gaining from the Twitter community. There is an increased focus on analytics as company’s want to monetize social media i.e. convert followers into actual customers and drive ROI. By utilizing Twitter Analytics, you can create more targeted and tactical communication content for your campaign and potentially drive customers to your business as well.
To get started, turn analytics on for your account by first logging into www.analytics.twitter.com with your Twitter username and password. Once analytics is on, you can easily access it from your Twitter homepage here:
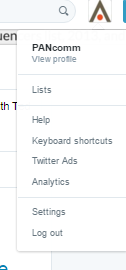
The Twitter Analytics home page gives you a quick snapshot of your activity over the last 28 days on Twitter. From this home page, you can toggle on the top bar to see Tweets, Followers, Twitter Cards and Tools (which you can use for a paid Twitter ad campaign).
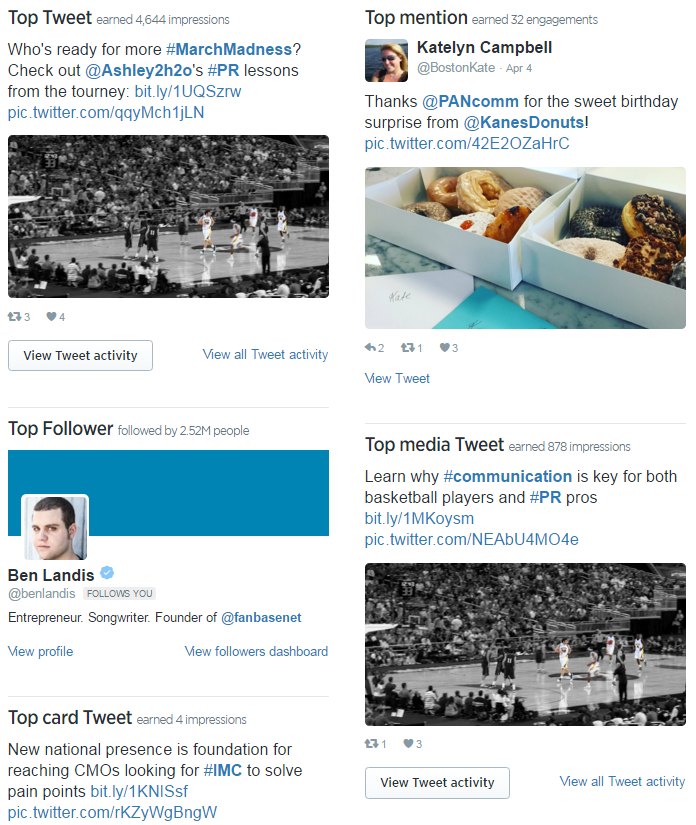
The Twitter Analytics home page also creates tweet highlights for each month in a highly visual format. From the highlights you can easily view the top tweet, top mention, top follower, top media tweet and top card tweet:
-
Benchmarking and Testing
Before beginning a Twitter campaign it is important to benchmark. By benchmarking your company’s Twitter account before the campaign begins, you can compare this data to new data obtained while the campaign is running to determine how successfully or unsuccessfully the campaign is performing. With Twitter, you can review your Twitter performance before the campaign began by looking back into your page history and selecting the appropriate date ranges.
Benchmarking allows you to make adjustments to the campaign as needed for optimal engagement. For Twitter campaigns, it is important to access your progress at least on a weekly basis to determine how much traction your campaign is gaining. (Shorter campaigns may require monitoring progress on a daily basis while longer campaigns may require monitoring progress on a bi-weekly or monthly basis.)
Overall, it’s a good rule of thumb to benchmark your Twitter following and engagement against your competitors. Accessing the content and types of campaigns your company’s competitors are running can spark new ideas and approaches for your company’s Twitter page. This type of benchmarking can be done on an on-going basis.
With A/B testing, you can see what type of content is working best for the campaign and experiment with a few variations of a tweet. A/B testing allows you to refrain from making assumptions and large generalizations about your Twitter followers. Perhaps your followers are more receptive to video content than photo content so testing a few variations will make your content more tailored and strategic.
-
Measuring using Twitter Analytics
Twitter Analytics offers substantial information in terms of measuring the success of your campaign.
By utilizing measurement protocols, you can establish the effectiveness of the Twitter campaign – especially in driving ROI for your company – in order to understand the next strategic steps that need to be taken.
Once you toggle over to the ‘Tweets’ section on the top bar from your Twitter Analytics home page, you can view a summary of your Tweet Activity.
You can also view the latest tweets from your page and the number of impressions, engagement and the engagement rate.
Twitter Analytics automatically defaults to pull data from the last 28 days. However, you can click on the drop-down menu marked ‘Last 28 Days’ to set your start date and end date for the analytics data you would like to view.

-
Qualitative and Quantitative Measurement
Measurement is important to determine whether the campaign goals and objectives have been met based on the awareness, acceptance or actions of the target audience. The information provided by Twitter Analytics is primarily descriptive data only so it’s important to also highlight contextual information from the campaign as well. By using qualitative and quantitative information, your team and superiors can have an accurate view of how the campaign is progressing.
While the metrics from Twitter Analytics provide quantitative measurements, qualitative measures can be included such as the highest impression tweet and the highest engagement tweet. Using visual data brings a compelling element to the data and allows the client to see what kinds of content (images, videos, popular hashtags, etc.) are working best. Bar graphs like the tweet impressions can also be added.
-
The Five Best Metrics
There are five top metrics to show your company that highlight the success of the campaign:
- New Followers Gained: How followers increased over the selected timeframe
- Total Followers: Latest number of followers
- Engagement Rate: The percent of engagement based on clicks, retweets, replies, follows and favorites
- Impressions: The number of times users saw the tweet on their Twitter newsfeed
- Demographics: Key information like sex, top interests and top cities of followers that can aid in tailoring content to your specific audience
These five metrics are key performance indicators for your campaign because they allow you to determine the traction you are obtaining from the campaign. By looking at this information, decisions can be made early on whether the content needs to be completely revamped to better tailor to the audience or adjusted slightly for additional engagement.
While this is not a metric found on Twitter, website traffic to your company’s page can also showcase the success of your Twitter campaign. By using UTM parameters in your tweets, you are able to accurately determine referral traffic to your website. In addition to spikes in website traffic, other useful website visitor information will be discovered such as how much time a visitor spent on the company page, and what sub-pages they visited on the website by reviewing a company’s Google Analytics.
-
Twitter Cards
Twitter Cards allow you to create rich media content within Twitter that goes beyond the 140-character limit. Twitter Cards are free to make but can also be used in paid Twitter ad campaigns. By simply adding a few lines of HTML to your webpage you can create an engaging experience for your audience and any user whose tweets link to your content will have a ‘card’ added to the tweet that is visible to all of their followers. This can significantly boost the engagement rate of your company’s tweet.
There are four Twitter cards available:
- Summary Card: Designed to give the reader a preview of the content before clicking through to your company’s website
- Summary Card with Large Image: Designed to give the reader a rich photo experience, and clicking on the image brings the user to your company’s website.
- App Card: Designed to drive app installs by highlighting attributes such as the app rating and price
- Player Card: Designed to share video or audio content your company creates.
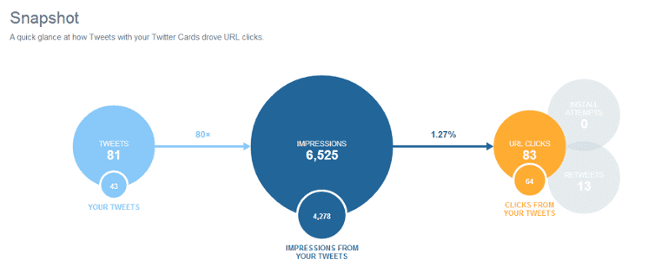
When utilizing Twitter Cards it’s important to monitor how they are performing compared to regular tweets and which types of rich media content are driving the performance rate of your tweet. To view analytics for your Twitter Cards, simply toggle to ‘Twitter Card’ from your Twitter Analytics homepage. From this page you will be able to view a snapshot, change over time, card types, links, influencers, tweets and sources.
In terms of metrics, the snapshot tells you a great deal of information about how tweets with your Twitter Card drove URL clicks.
The other analytics items are:
- Change over time: How your Twitter Cards affected your impressions and clicks over a certain time period
- Card types: Highlights the top-performing Twitter cards that drove clicks
- Links: The links in tweets with your Twitter Cards that got the most clicks
- Influencers: Top accounts that tweeted links to your content
- Devices: Percentage of users that viewed your Twitter Cards that also have your company’s app installed
For more information on Twitter Cards, visit this site https://dev.twitter.com/cards/overview.
Analytics allow you to track and evaluate your campaign so you can easily determine what worked and what didn’t work and make appropriate adjustments moving forward.